
Simulation Modeling to Aid Marketing Strategy
- Russ Clay

- Feb 26, 2025
- 5 min read
Frequently in business, we are faced with imperfect information about the effect that strategy decisions will have on sales and revenue. We can make educated assumptions using historical data, but ultimately, we can’t be sure what the result of any changes might be. What if we don’t have a lot of historical data to go on? How can we use the information that we have to make the best decision possible?
Even without a mountain of high-quality data to guide us, we can always use the data that we do have, along with some grounded assumptions (recognizing where we have uncertainty), to build a simulation model which produces a valuable forecast.
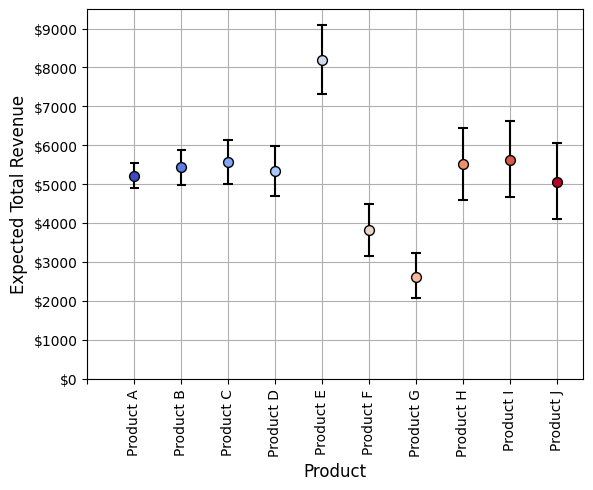
Pretend that we have data on 10 products from the most recent sales quarter. If we look at the figure below, we see the unit price of each of these 10 products plotted against their total revenue for the quarter. The size of each circle represents sales volume (larger dots represent more units sold). We can see that for most products, there is a pretty even tradeoff between price, volume, and total revenue. On average, higher priced items sell less, but end up generating comparable revenue over the quarter. The obvious exceptions are product E, which sells at a much higher volume than its price would predict and thus is the best revenue generator, and product F and G, which sell less and generate less overall revenue given their price:

We want to increase revenue and we want a defensible strategy for doing so. The first step we recommend is getting a sense of how much variability we might expect to see from one quarter to the next if we do nothing. This defines our baseline condition. We can use the data from this past quarter to build some expectations about how much variability we would expect in the total number of units ordered for each product, and from this, we can run some simulations to get a sense of how much we would expect our total quarterly revenue to vary assuming nothing changes, and the data that we have from the past quarter is pretty typical:
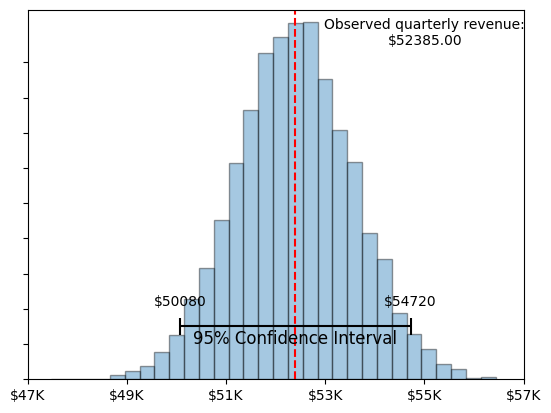
A few things that we want to pay attention to in these plots: 1) We can see in Figure 2 that there is more variability in the expected revenue from products that had lower sales volumes in our observed quarter relative to products that sold more. This is to be expected. 2) Figure 3 illustrates that shouldn’t be surprised if we do nothing and sales go up or down by about $2,000 or more (+/- 4%) in any given quarter. Given the data that we have, the change in sales would need to be larger than this before we really start to suspect that purchasing patterns have changed. In other words, we need to see at least a 5% increase to be confident that whatever we did actually improved our expected revenue.
The analysis and plots above provide basic information about the data from the most recent quarter, but there is a lot we can do with this information to make informed decisions about our strategy going forward. Now that we've got some baseline data, lets build simulations of a few specific scenarios:
Scenario 1 - Boost sales of our three best performing products (Products E, I, and C) by 5%.
Scenario 2 - Bost sales of our three worst performing products (Products G, F, and J) by 5%.
Scenario 3 - Boost sales of three randomly selected products (C, G, and H) by 5%.
In all scenarios, we create 10,000 simulated versions of a sales quarter, selecting a random number of orders for each product from updated statistical distributions, and we see how these strategies perform.
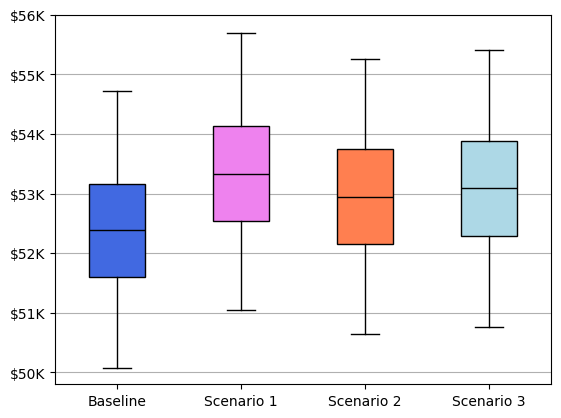
Scenario 1, where we focus on boosting sales of the 3 products that are already our best performers, appears to give us the highest likelihood of an overall revenue increase. The total revenue from this scenario was higher than the simulated revenue under baseline conditions 72.3% of the time. 15.5% of the time, the increase in revenue was at least 5% higher than baseline.
These are just three examples of scenarios we could explore with simulation. To be clear, this type of modeling always comes with uncertainty. In the examples above, we are assuming we can boost product sales by 5%. We haven’t said how we will increase sales, or what it will cost – those are separate questions, and if we have additional data we could build estimates of those types of items into our simulation as well. Also, real simulation work that is intended to support actual business decisions will typically be much more complex and will model a host of processes so that our model is as true to reality as possible. We kept it simple here for the sake of illustration.
The main takeaway is that simulation is a process that can be used to build valuable forecasts with limited data. Simulations doesn’t guarantee results, but they do help you kick the tires and build confidence about your strategy proposals. A couple of key points:
Simulation forecasting is dependent on assumptions. Always document your assumptions and think about how confident you are in them. If your assumptions are incorrect, your simulations will be misleading.
Focus on your uncertainty as much as your point estimates. In the above example, when we say that 72.3% of the time, scenario 1 outperformed the baseline, that still means that 27.7% of the time, it did not. Scenario 1 gives us the best chance at success, but we would still expect it to result in worse performance about 1 out of every 4 quarters. If that is not acceptable, keep building scenarios until you have uncertainty that you can live with.
Try lots of different scenarios so that you don’t go down a path of just inventing simulations that confirm your existing beliefs. Try to invent counter-intuitive scenarios, or ones that you think will produce less-than-desirable outcomes. The more of the scenario space you explore, the more of an understanding you will build about the process you are simulating.
As always, please reach out and contact us if you have questions or if you are interested in pursing this type of work for your business!


Comments